
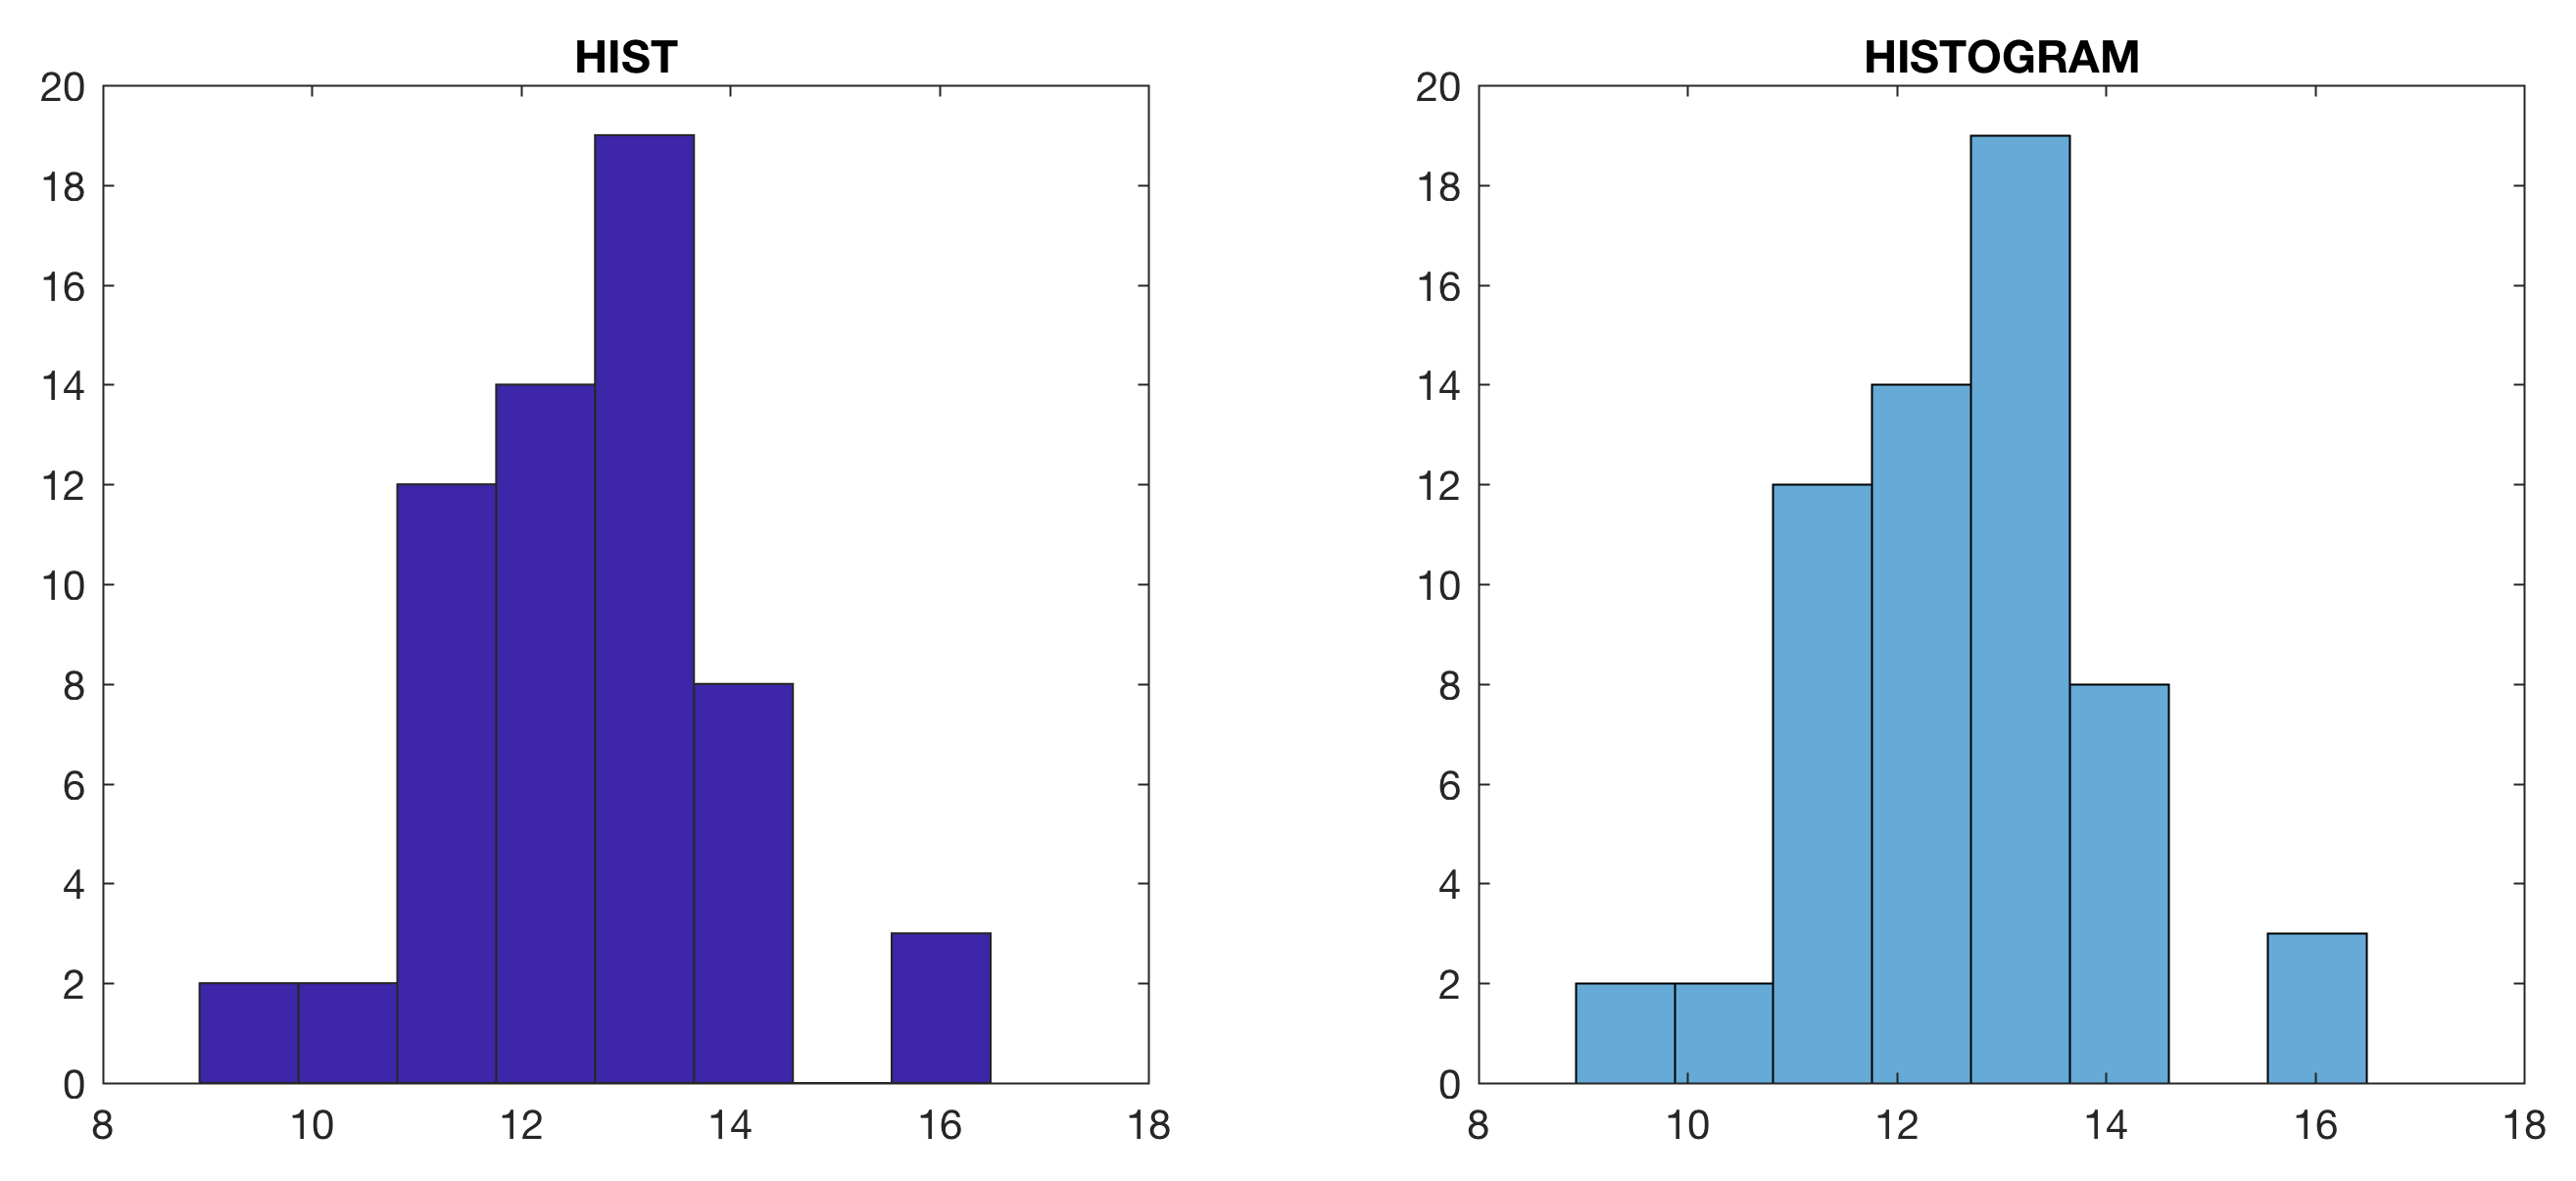
With release R2014b the new function histogram was introduced to replace the old function hist. Here is a script to reproduce the result of hist by the new function histogram.
According to the MATLAB documentation, unlike the hist function, the histogram function returns a histogram object that you can use to modify the properties of the histogram. Instead the output of the older hist function was the bin centers and the number of elements in each bin. To get these values, use the new function histcounts together with histogram. Here is a script to create the histogram plot together with the numerical output of the counts, bin centers and bin edges. First we create the histogram without using hist and histogram:
clear, clc, close all
rng(0)
data = 12.34 + 1.16 * randn(60,1);
nbin = round(sqrt(length(data)));
vmin = min(data) + 0.5*range(data)/nbin;
vmax = max(data) - 0.5*range(data)/nbin;
vwth = range(data)/nbin;
v = vmin : vwth : vmax % Bin centers
emin = min(data);
emax = max(data);
ewth = range(data)/nbin;
e = emin : ewth : emax % Bin edges
for i = 1 : nbin
    if i < nbin
        datab = data(emin+(i-1)*ewth<= ...
        data & emin+i*ewth>data);
        n(i) = length(datab);
    else
        datab = data(emin+(i-1)*ewth<=...
        data & emin+i*ewth>=data);
        n(i) = length(datab);
    end
end
n
bar(v,n,1.0,...
   'FaceColor',[0 0.4470 0.7410],...
   'FaceAlpha',0.6), title('MANUAL')
 Next we create the histogram using hist:
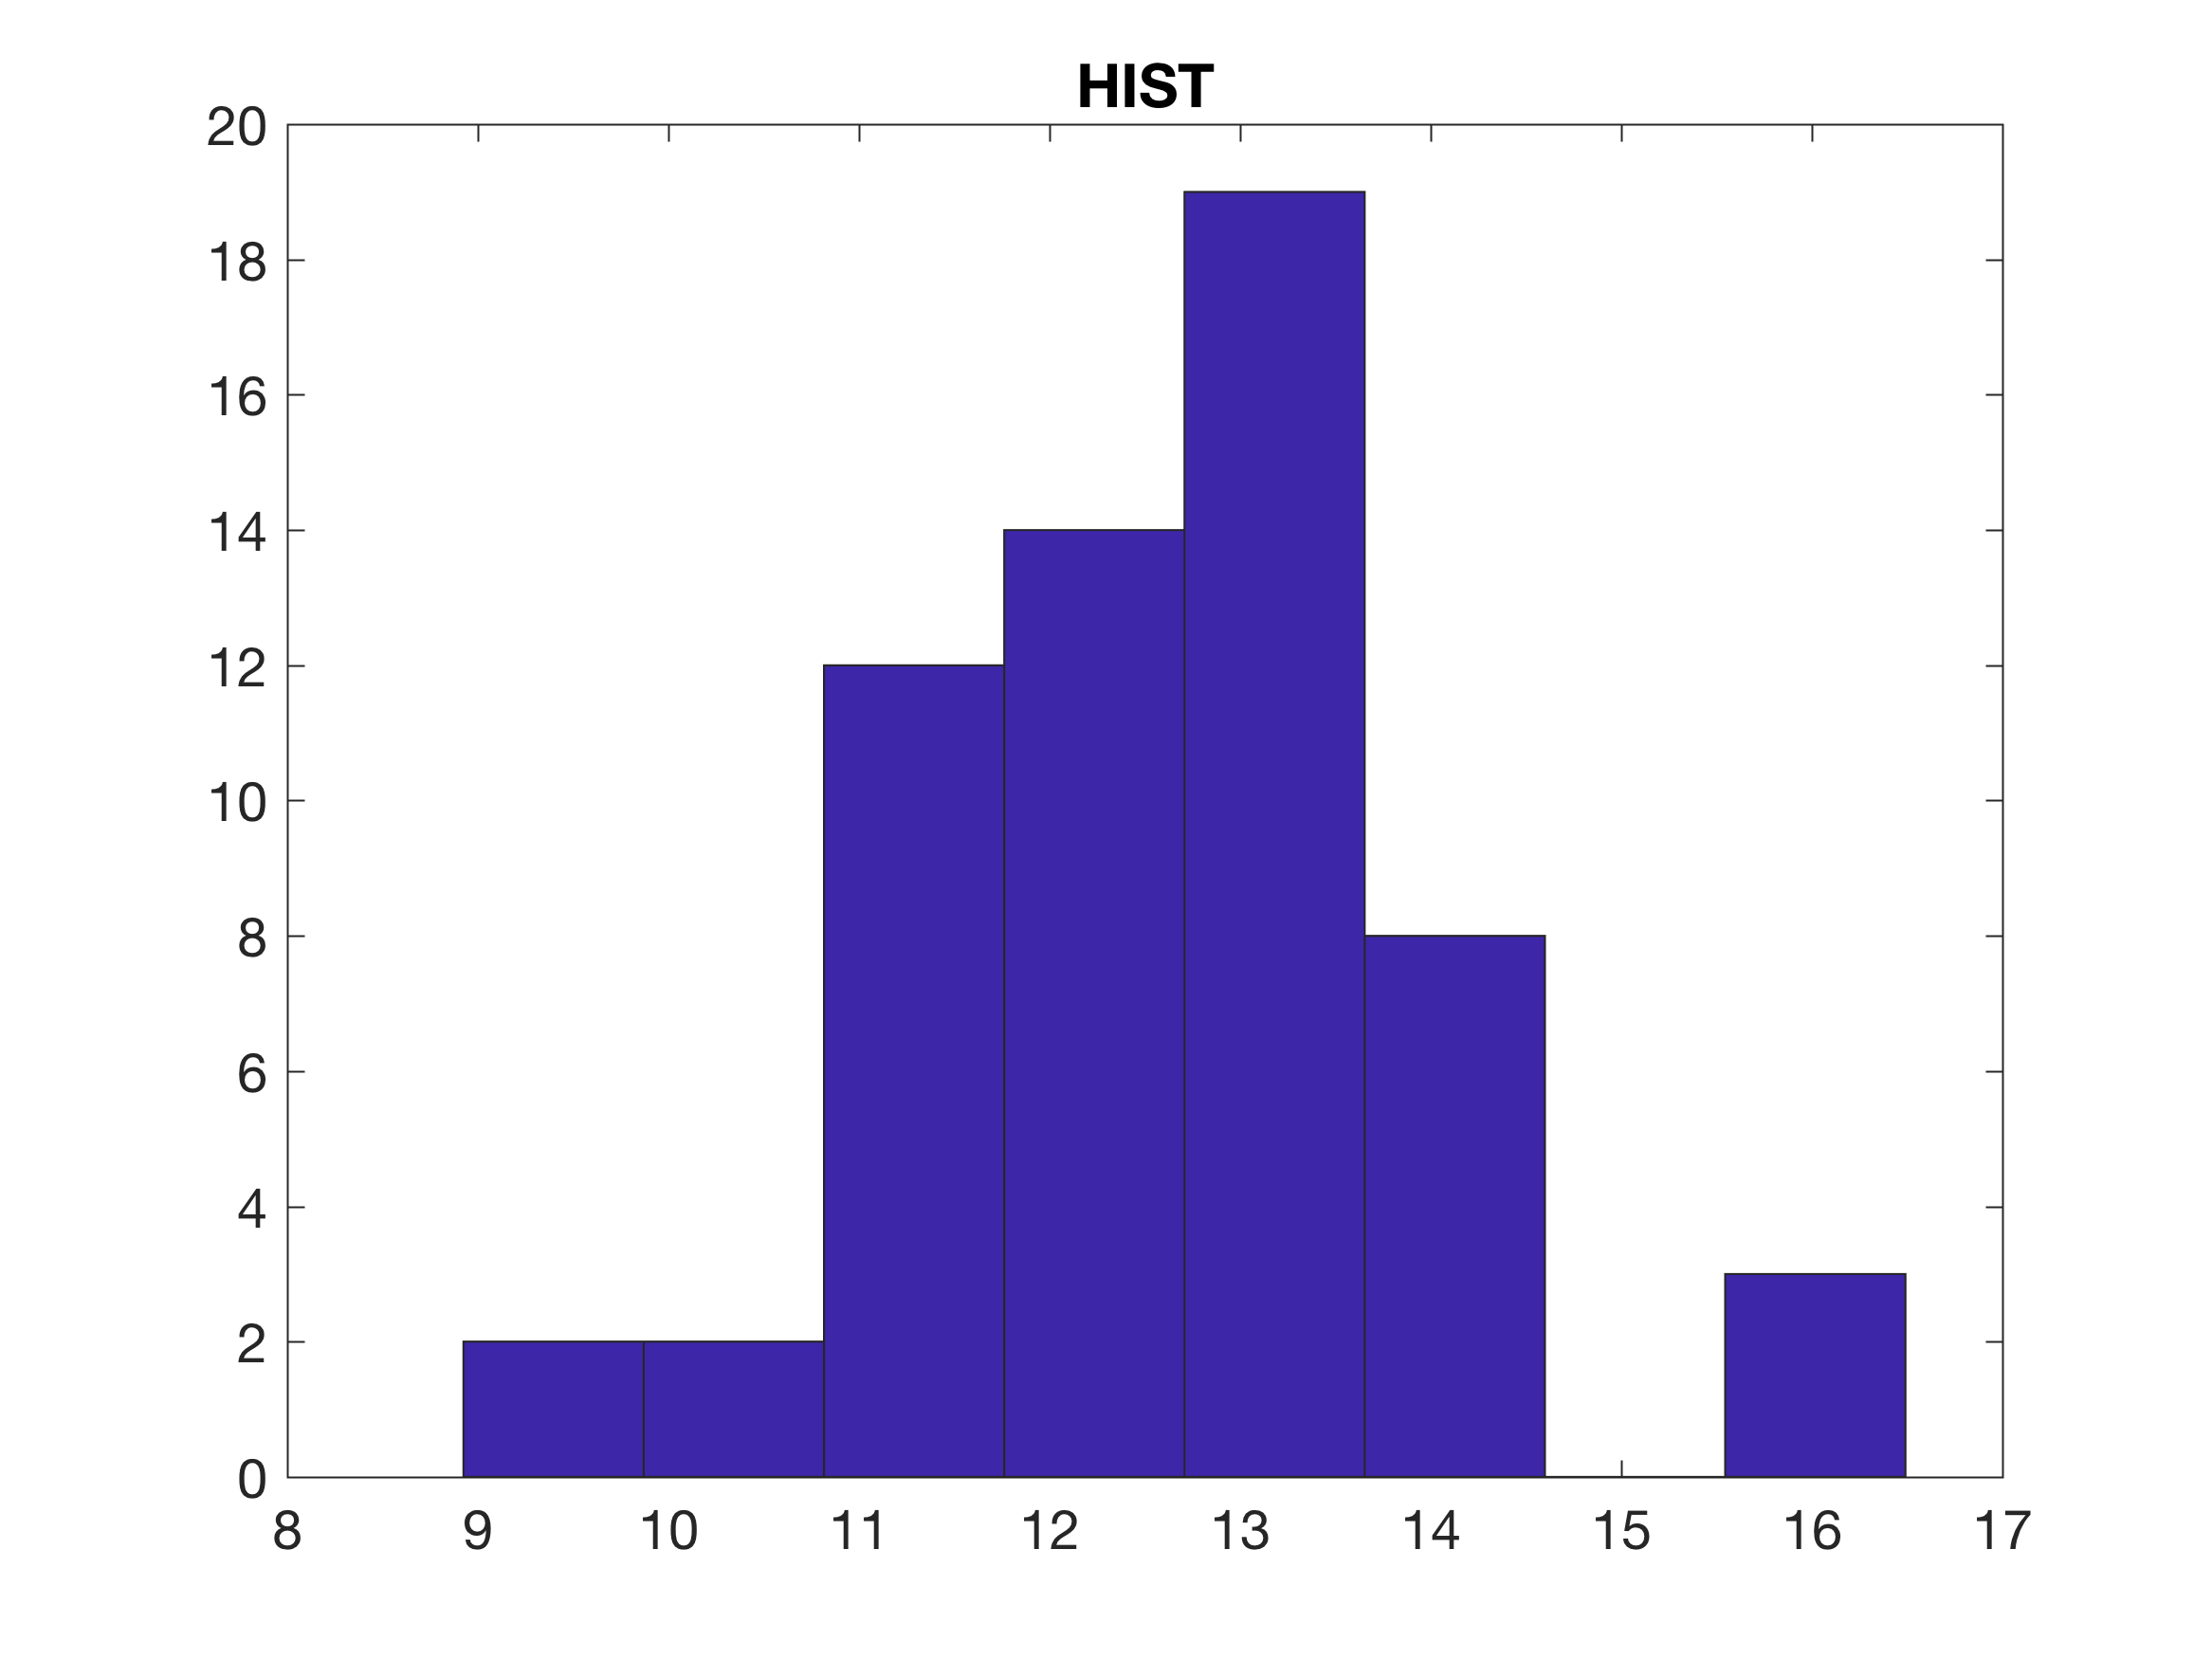
hist(data,v), title('HIST')
[n,v] = hist(data,v);
n, v, e
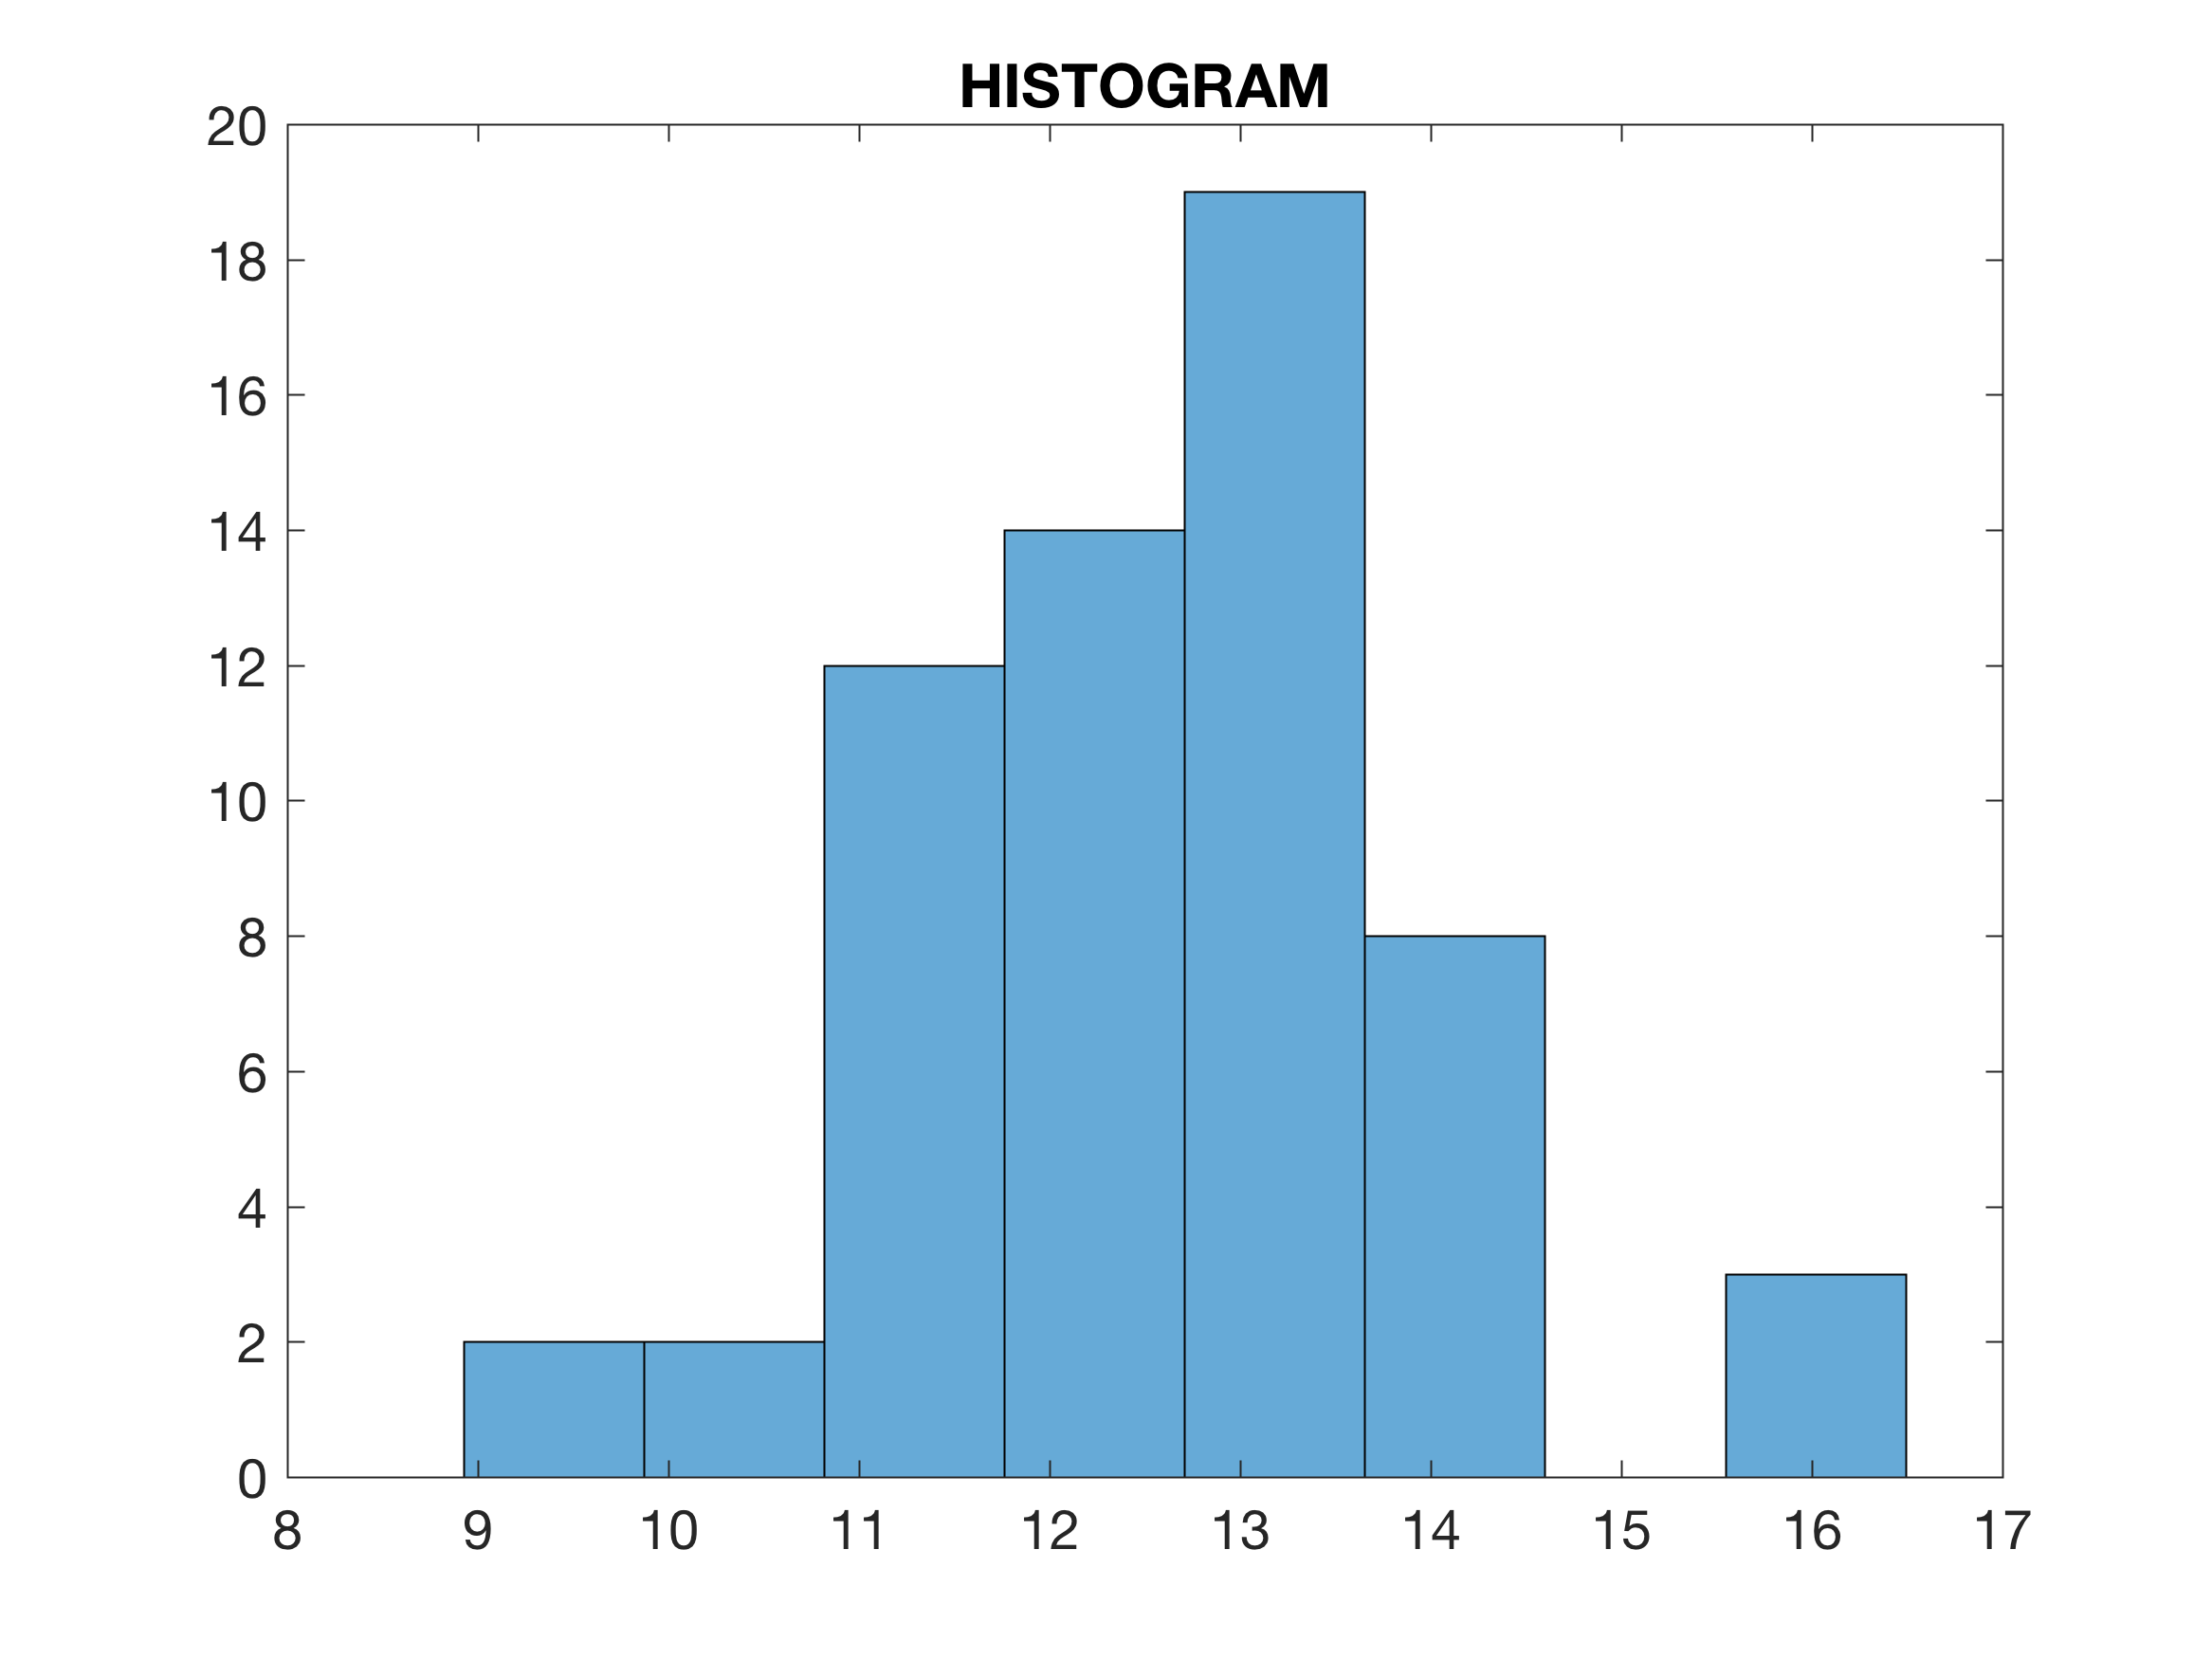
 Finally we create the histogram using histogram:
h = histogram(data,e);
title('HISTOGRAM')
v = h.BinWidth * 0.5 + h.BinEdges(1:end-1);
n = h.Values;
[n,e] = histcounts(data,e);
v = diff(e(1:2)) * 0.5 + e(1:end-1);
n, v, e
 For the details about the various function please read MRES.