
 Running means are very popular to smooth noisy time series. Unfortunately, they have unpleasant side effects. Here is a MATLAB example to demonstrate the effect of running means.
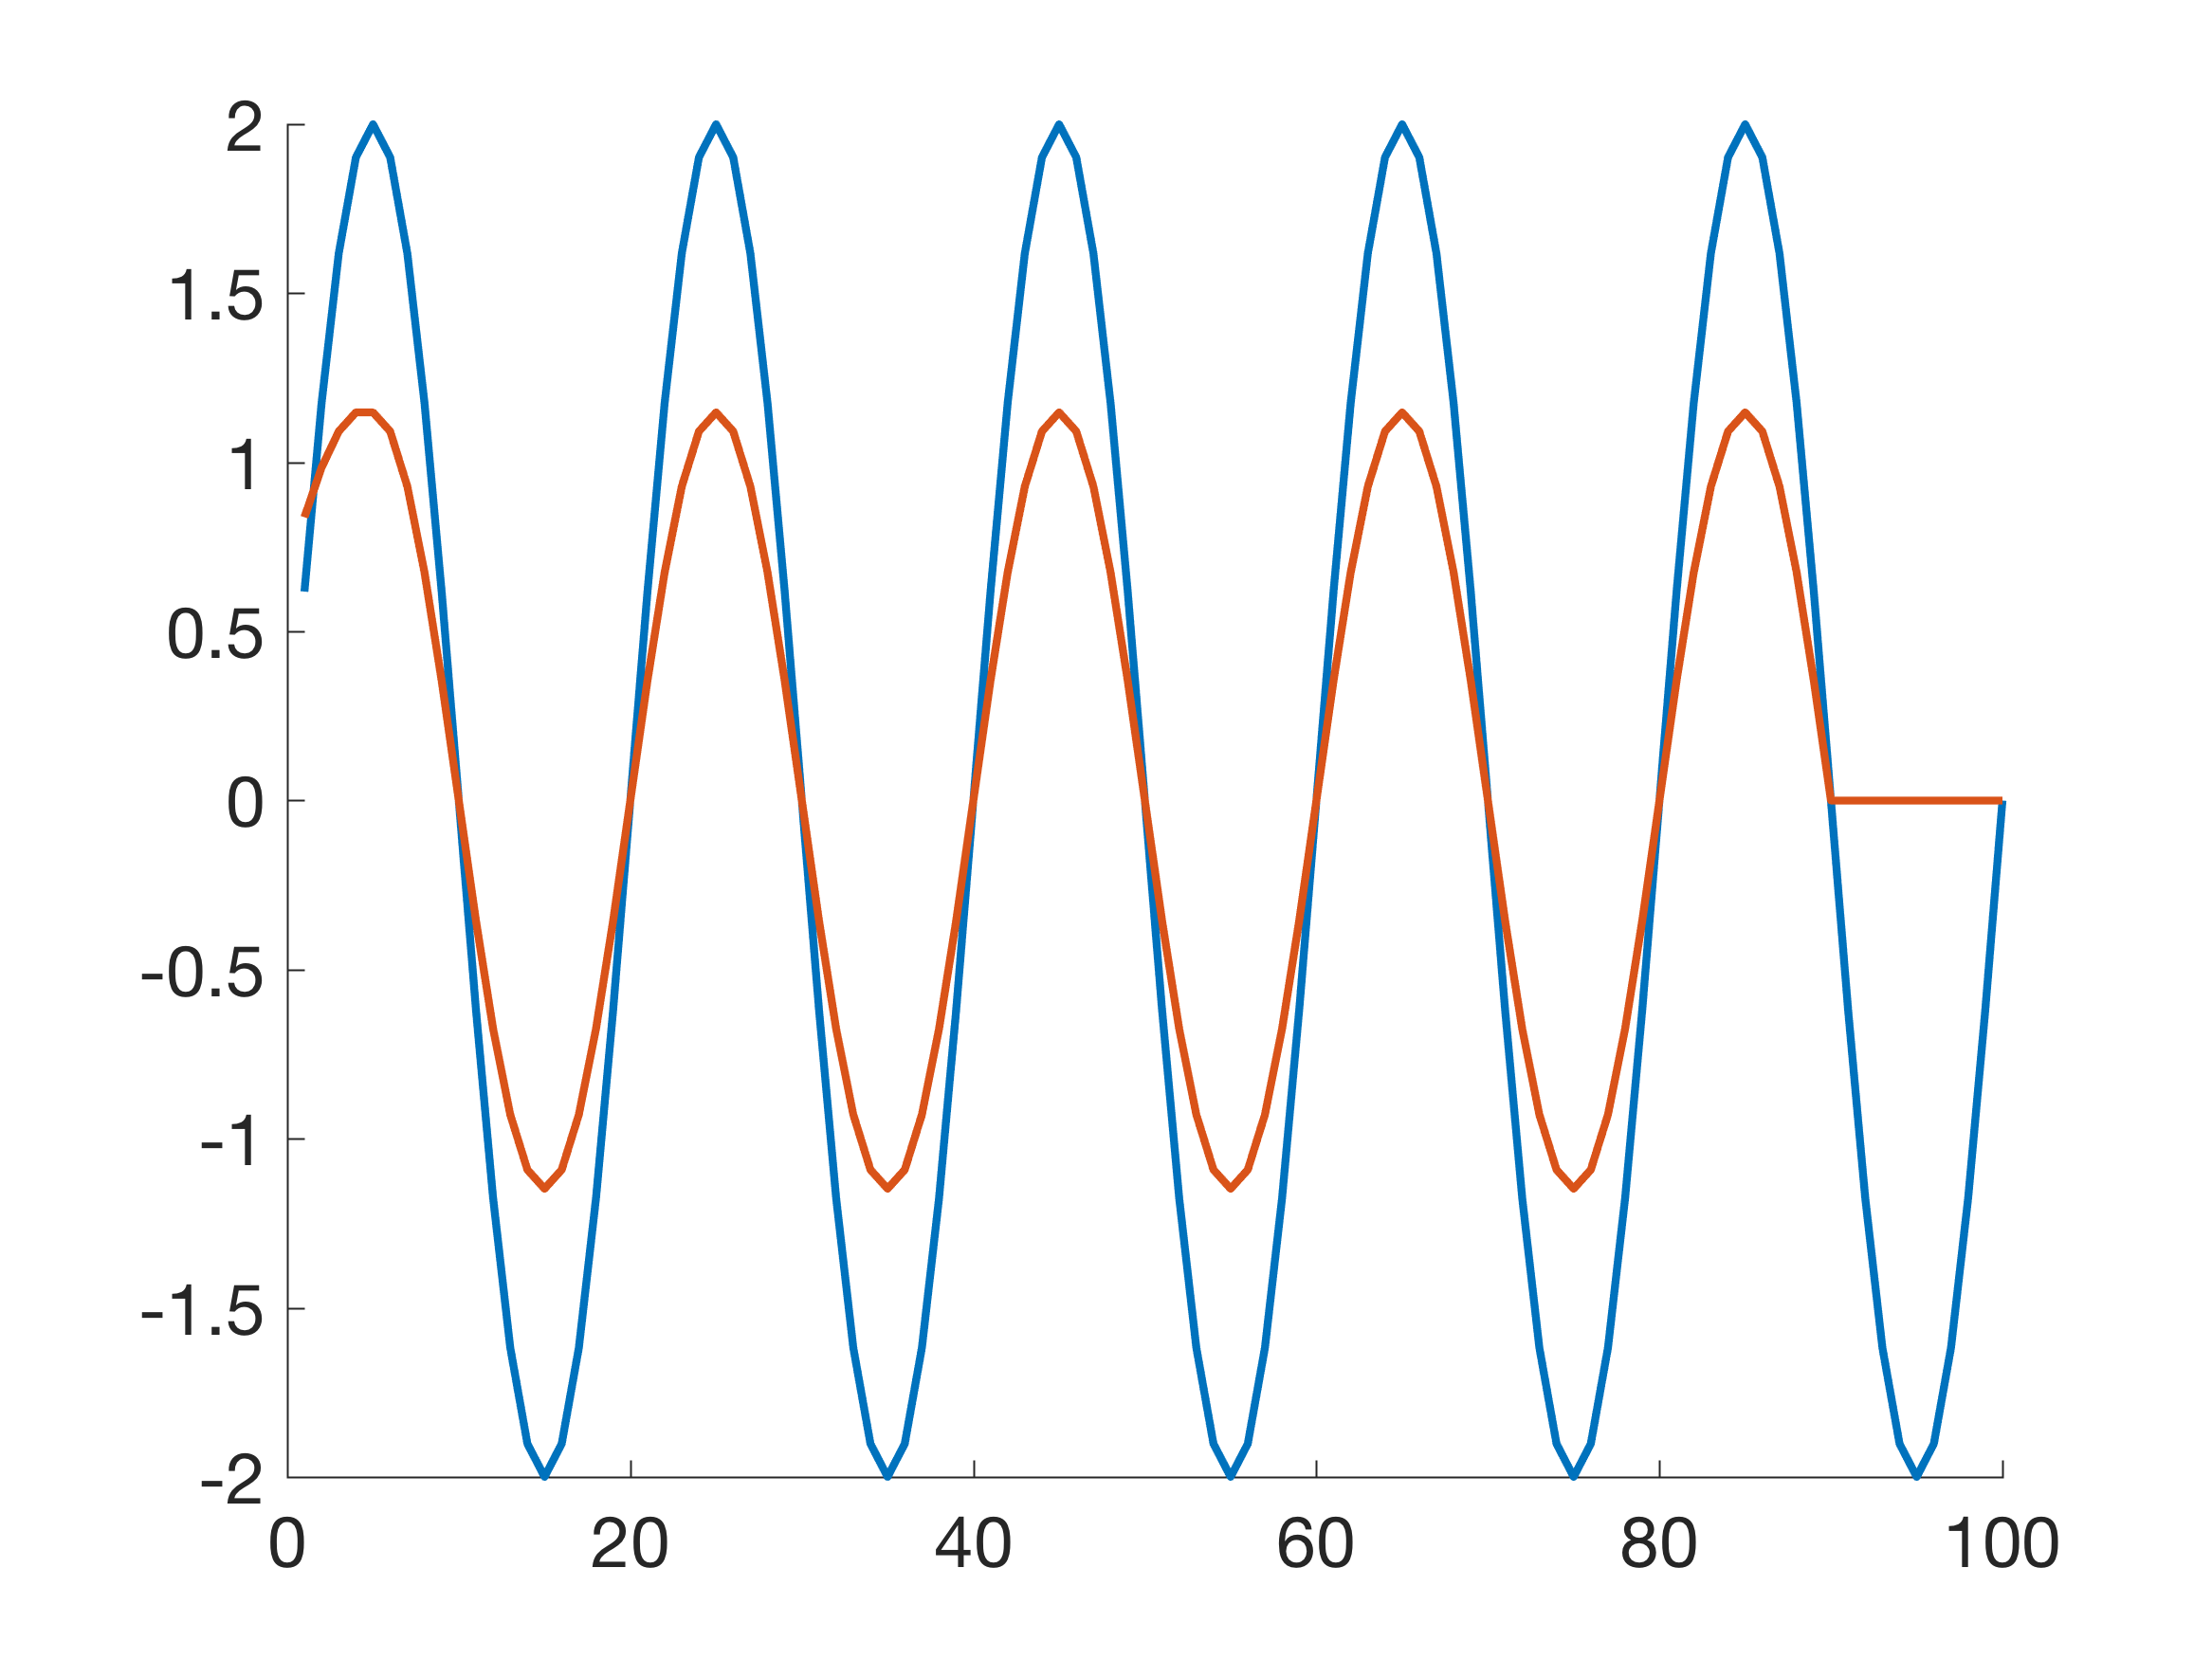
Let us a create a simple sine wave x8 with a period of 20 as an example. Then a running mean over eleven elements b8 is designed and this filter applied to the input signal x8. The phase of the output y8 is corrected for causal indexing. Plotting the results clearly shows the expected decrease of the amplitude by about 42%.
clear
t = (1:100)';
x8 = 2*sin(2*pi*t/20);
b8 = ones(1,11)/11;
m8 = length(b8);
y8 = filter(b8,1,x8);
y8 = y8(1+(m8-1)/2:end-(m8-1)/2,1);
y8(end+1:end+m8-1,1) = zeros(m8-1,1);
plot(t,x8,t,y8)
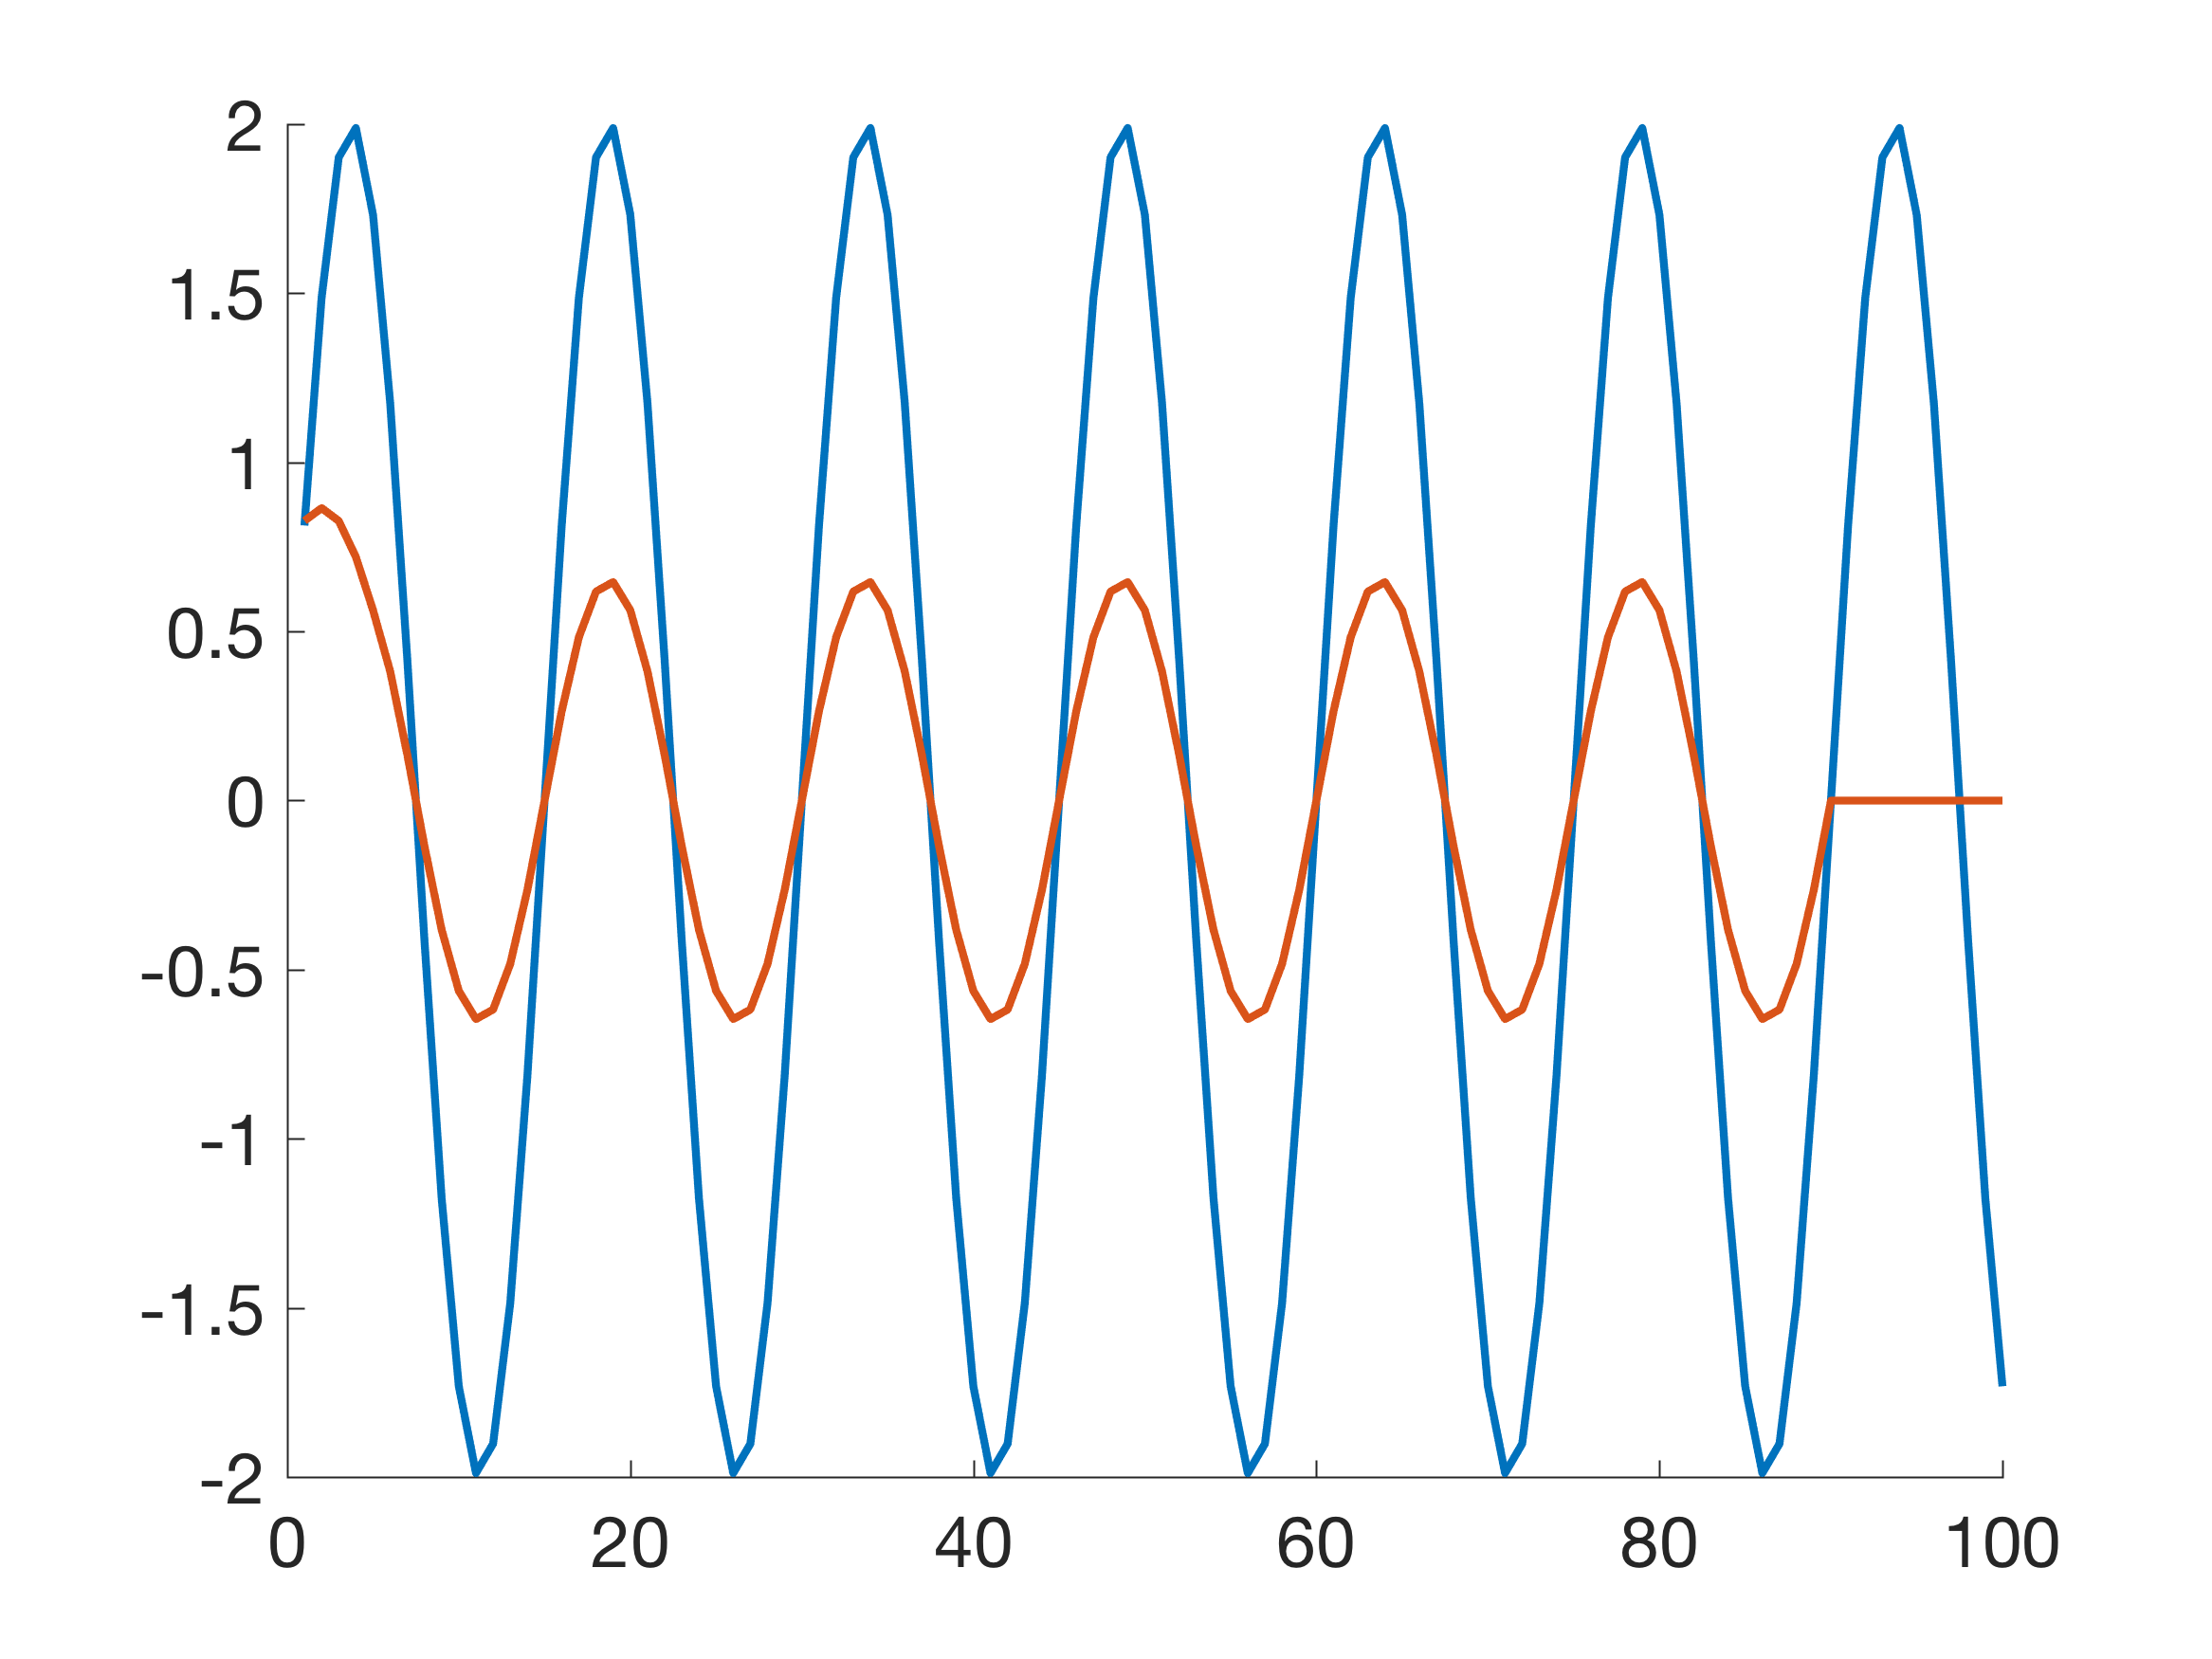
Using the same filter the amplitude of a sine wave x9 with a period of 15 is, as expected, reduced by 68%.
x9 = 2*sin(2*pi*t/15);
b9 = ones(1,11)/11;
m9 = length(b9);
y9 = filter(b9,1,x9);
y9 = y9(1+(m9-1)/2:end-(m9-1)/2,1);
y9(end+1:end+m9-1,1) = zeros(m9-1,1);
plot(t,x9,t,y9)
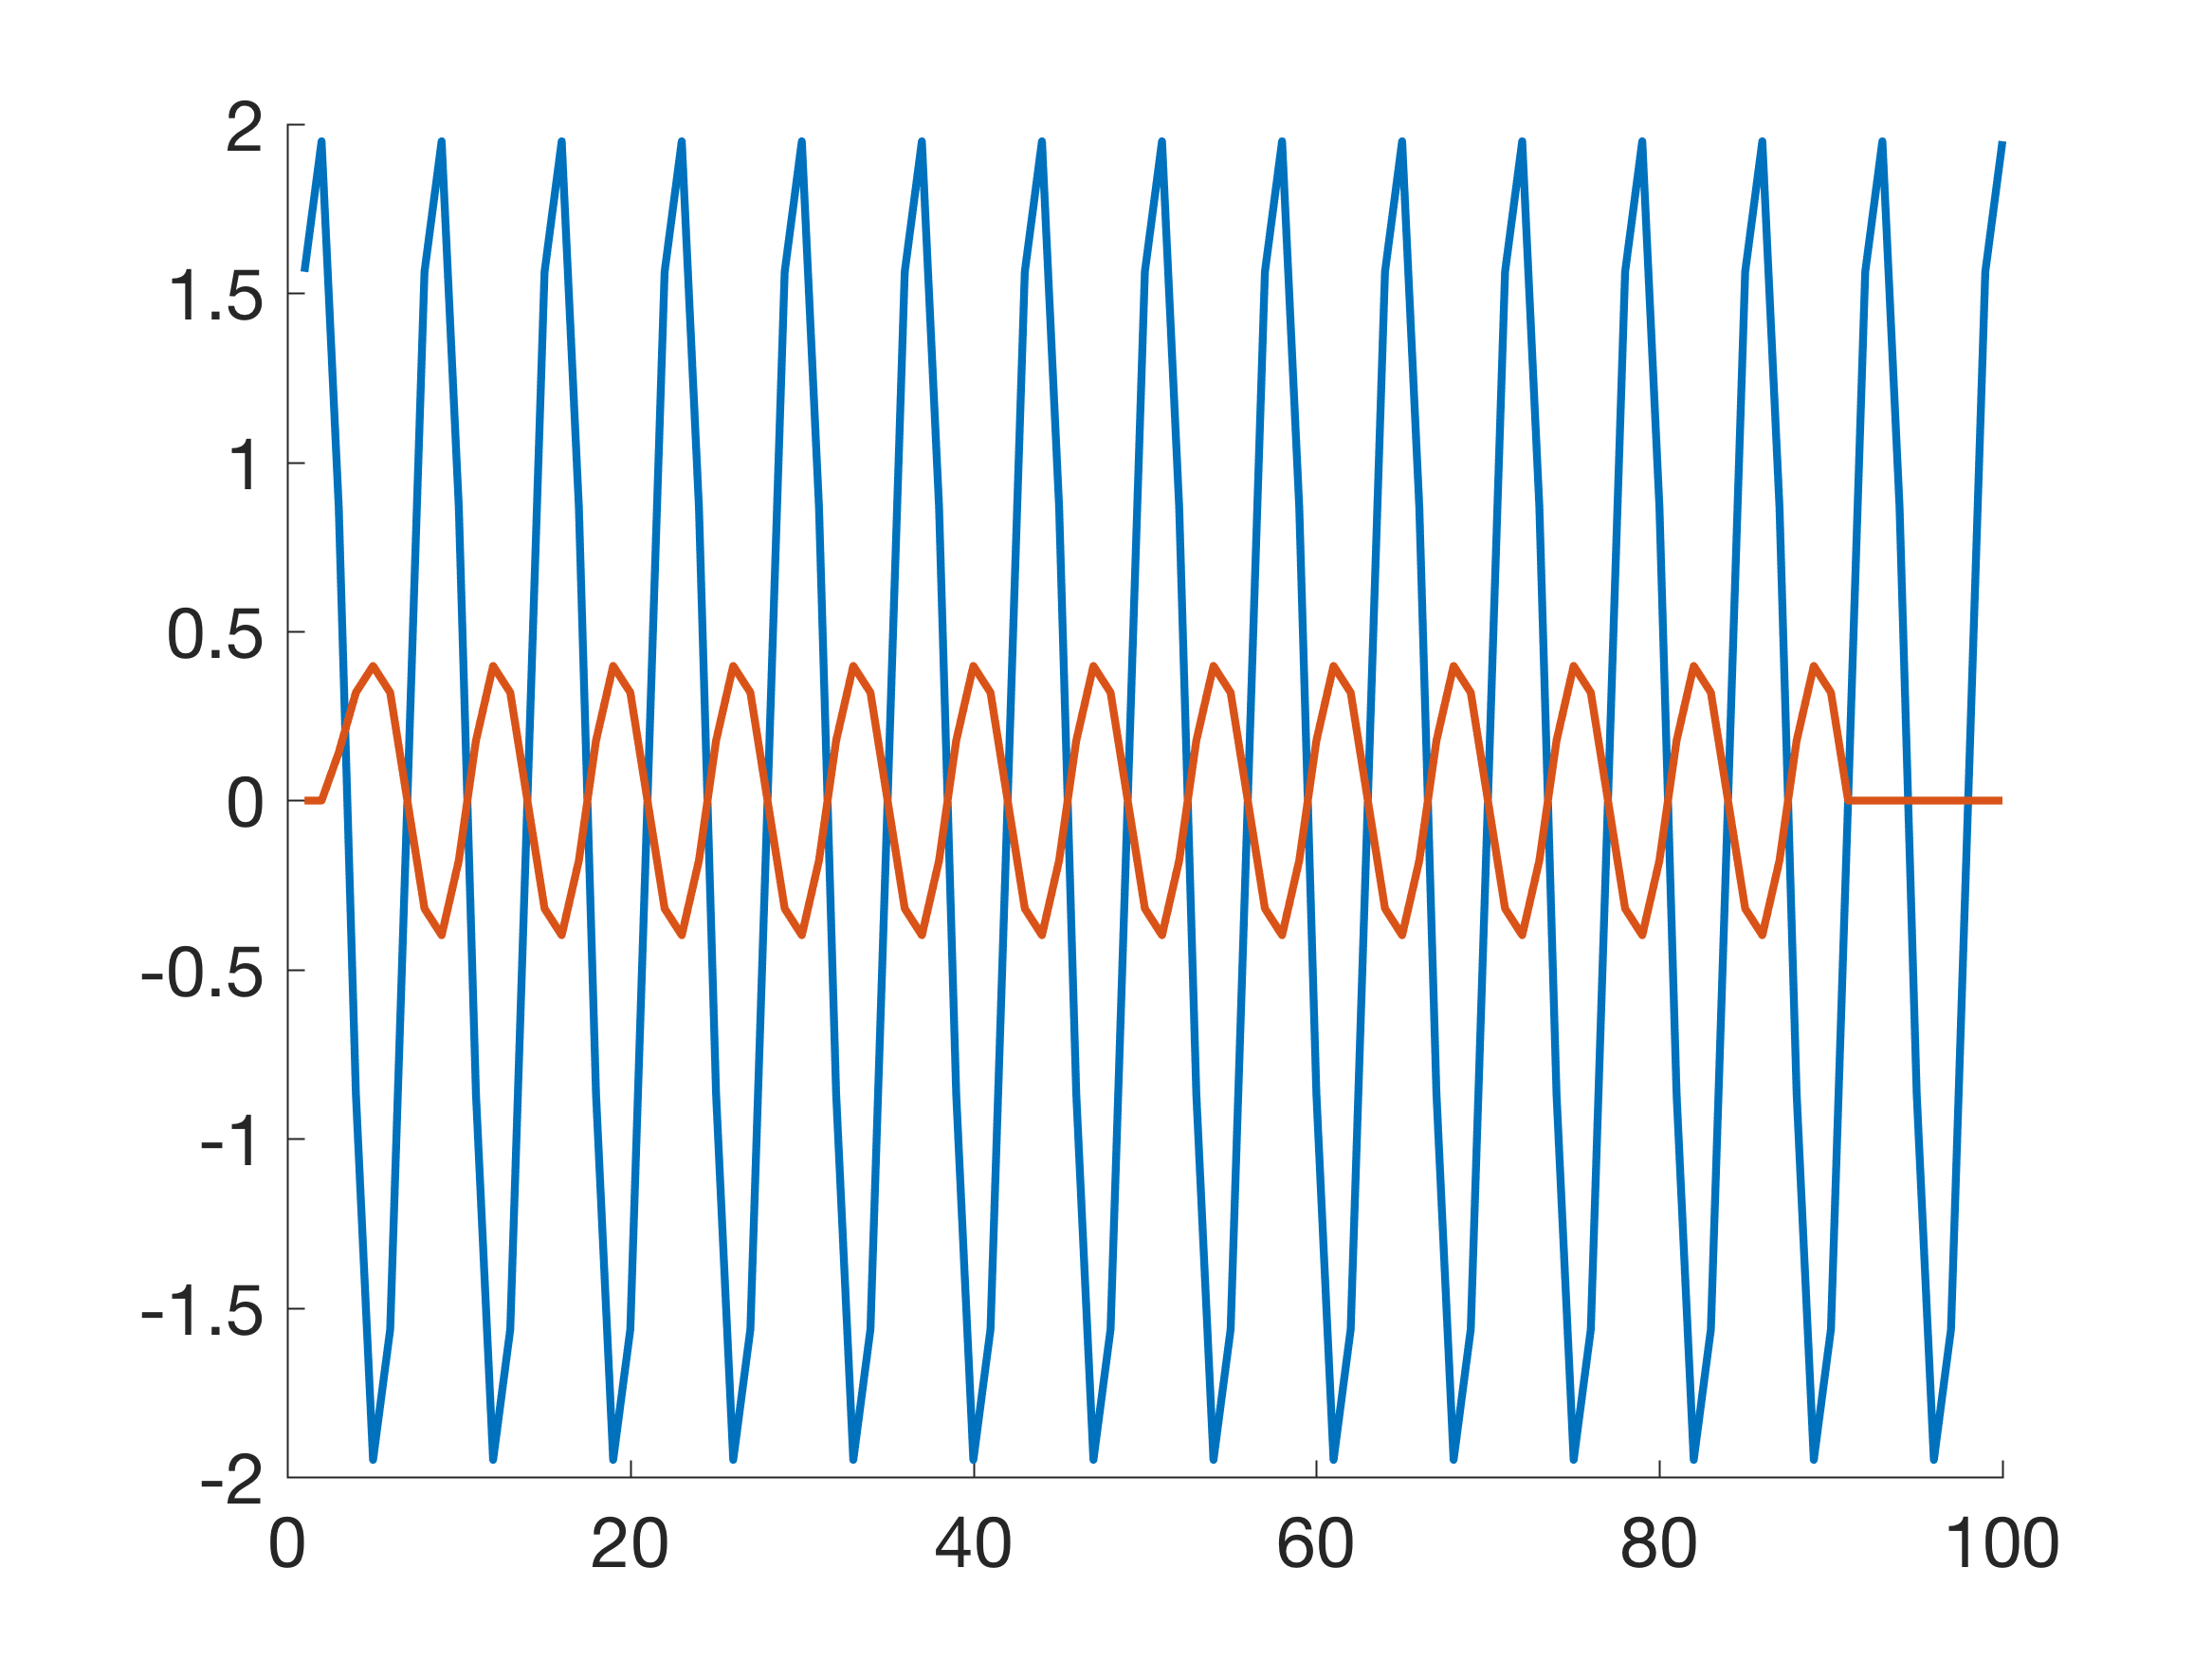
Now have a look at the effect of the filter on a sine wave with a wave length of 7: the amplitude is reversed.
x10 = 2*sin(2*pi*t/7);
b10 = ones(1,11)/11;
m10 = length(b10);
y10 = filter(b10,1,x10);
y10 = y10(1+(m10-1)/2:end-(m10-1)/2,1);
y10(end+1:end+m10-1,1) = zeros(m10-1,1);
plot(t,x10,t,y10)
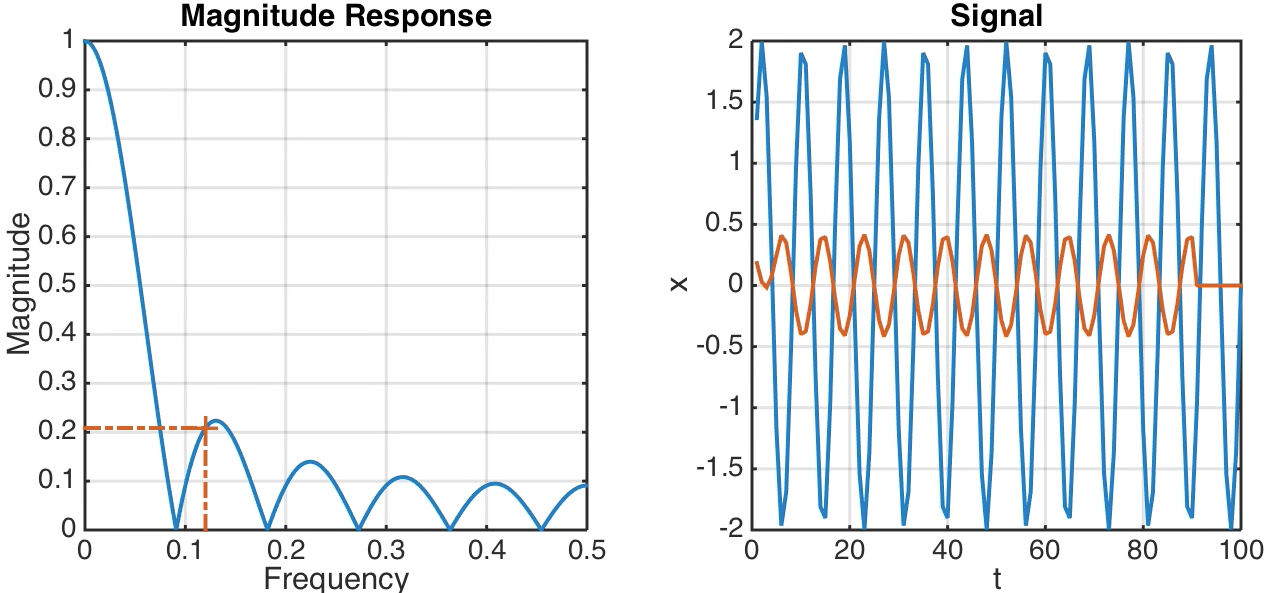
Having a look into the frequency domain.
b10 = ones(1,11)/11;
[h,w] = freqz(b10,1,512);
f = 1*w/(2*pi);
magnitude = abs(h);
plot(f,magnitude)
xlabel('Frequency'), ylabel('Magnitude')
title('Magnitude')
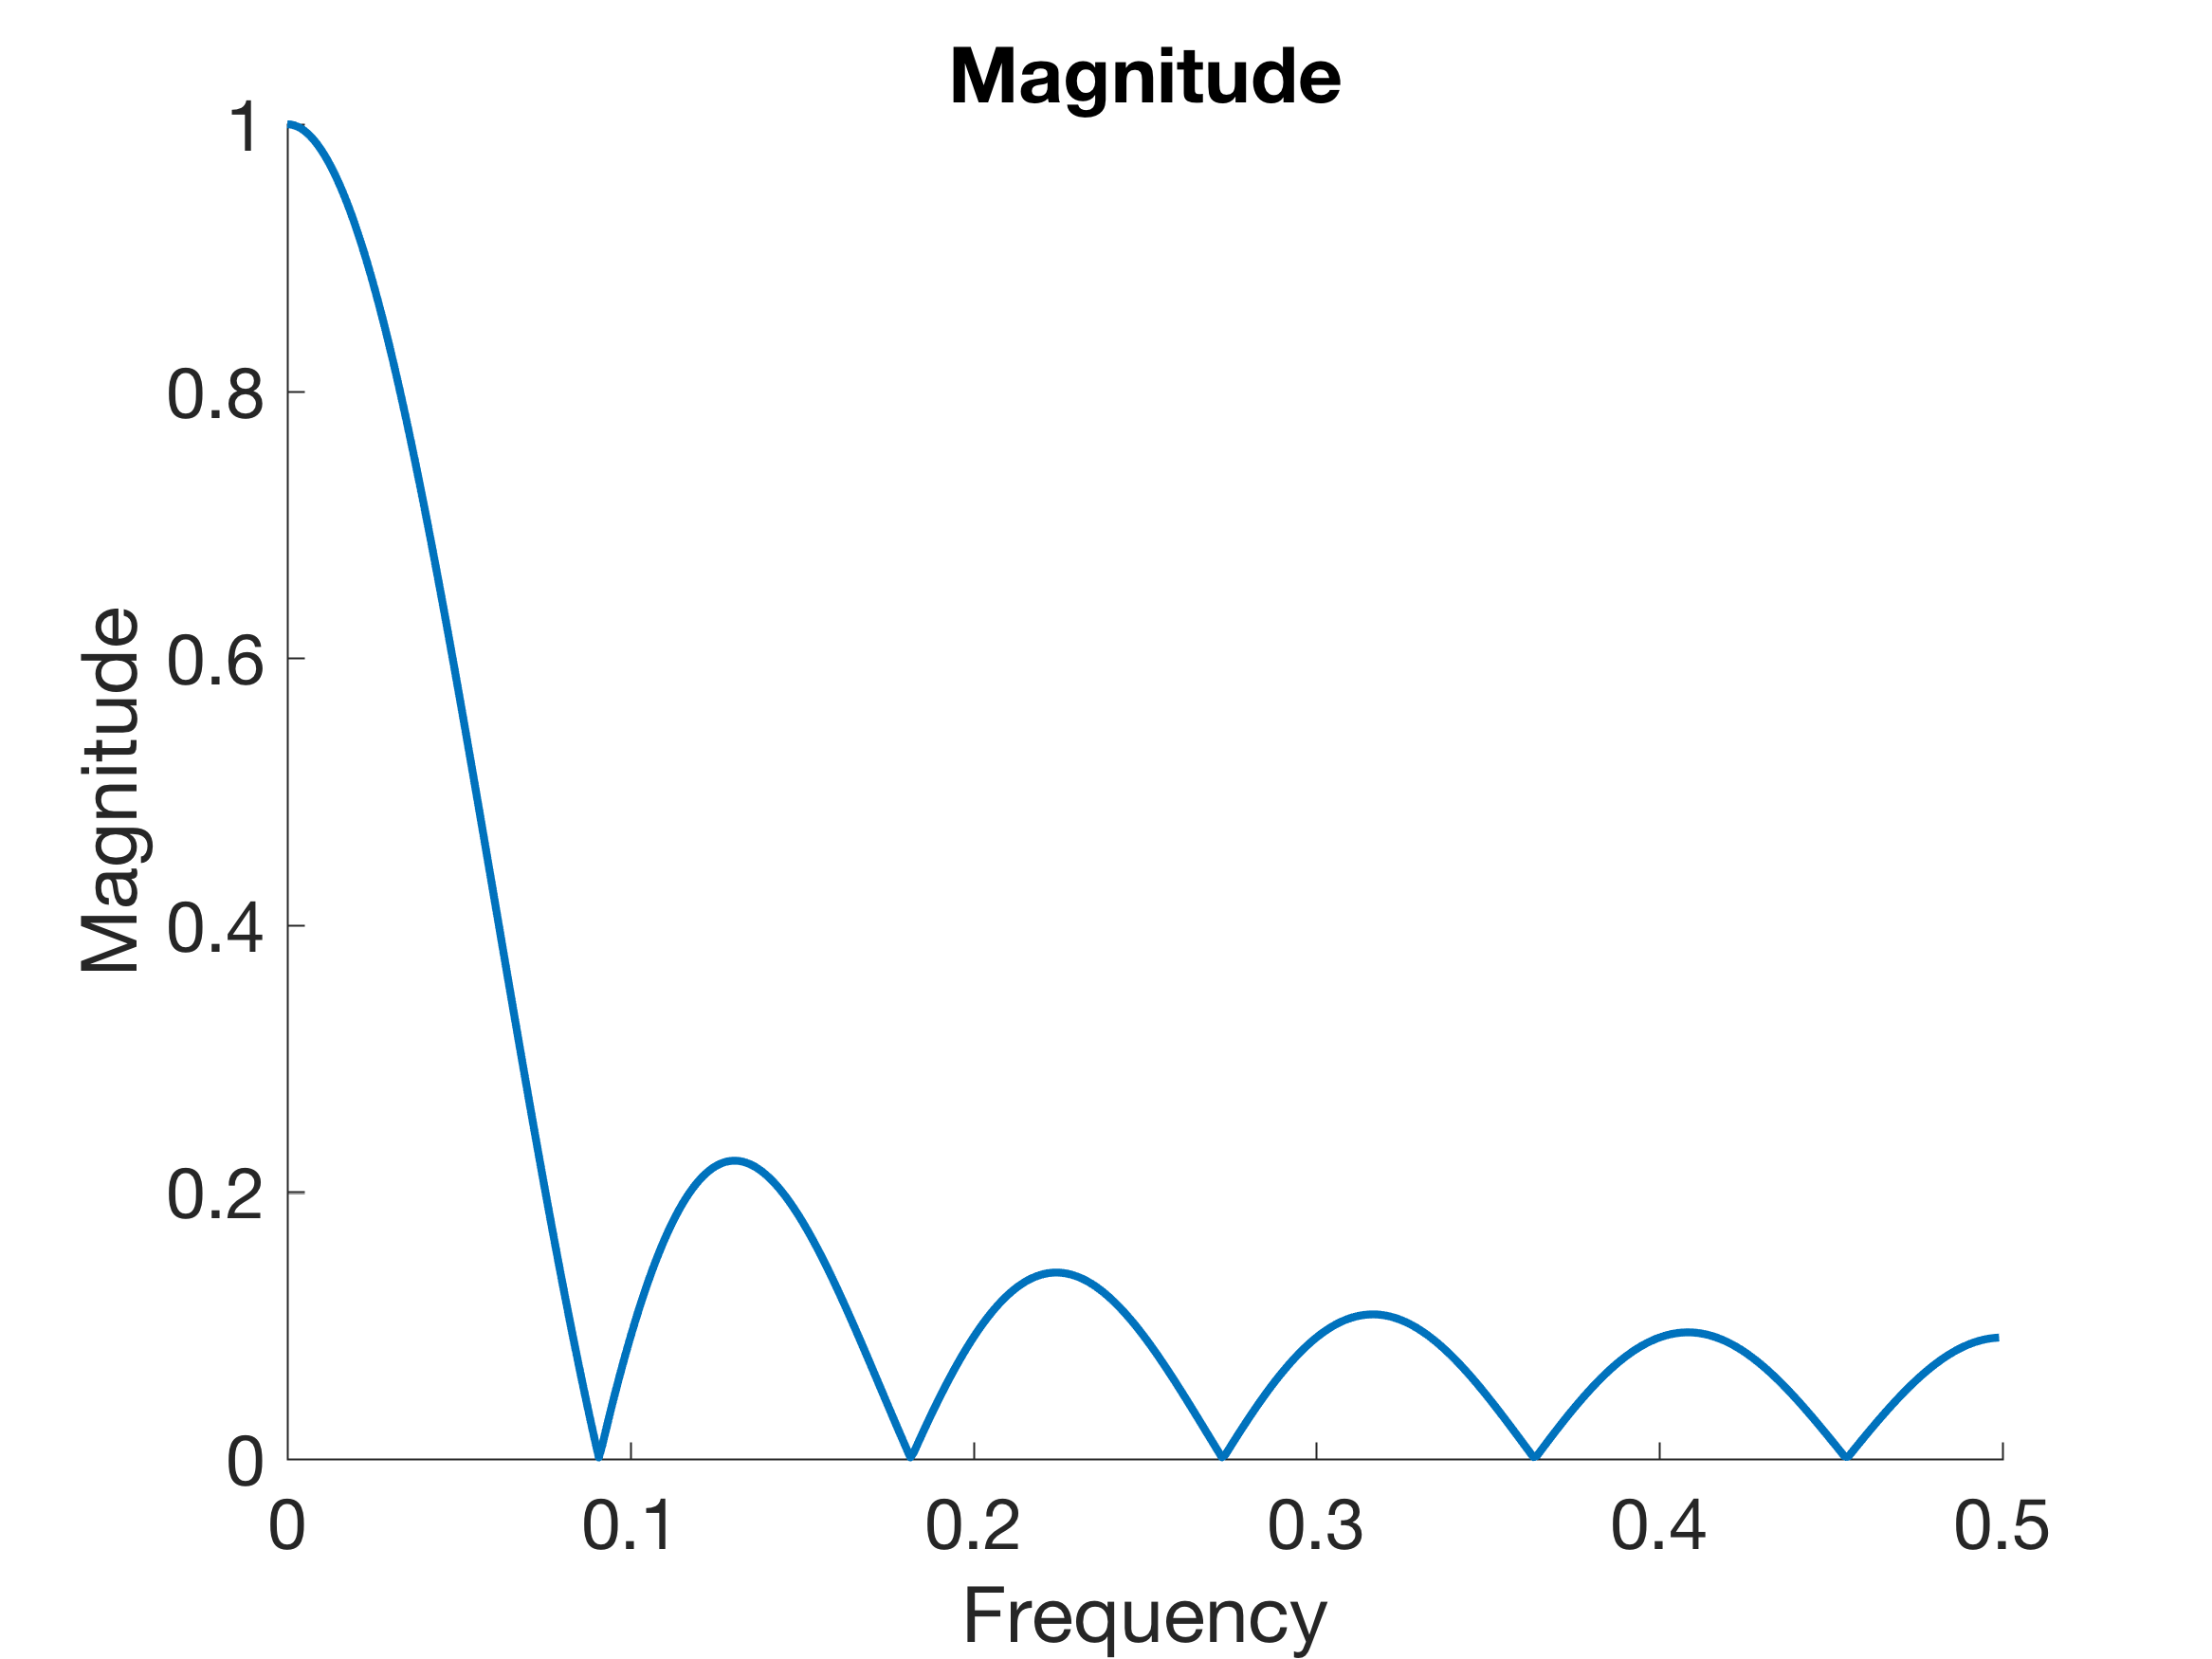
This plot can be used to predict the effect of the filter for any frequency of an input signal. As an example, applying the filter to a signal with a period of approximately 1/0.09082 completely eliminates that signal. Furthermore, since the magnitude of the frequency response is the absolute value of the complex frequency response h, the magnitude response is actually negative between ~0.09082 and ~0.1816, between ~0.2725 and ~0.3633, and between ~0.4546 and the Nyquist frequency. All signal components having frequencies within these intervals are mirrored on the t-axis.
The elimination of certain frequencies and flipping of the signal have important consequences when interpreting causality in earth sciences. These filters should therefore be avoided completely, even though they are offered as standards in spreadsheet programs. As an alternative, filters with a specific frequency response should be used, such as a Butterworth lowpass filter contained in the Signal Processing Toolbox of MATLAB (Chapter 6.9 of MRES).